Following on from last month’s first monthly update I bring you the new features and bug fixes that we completed in February. I’m pretty happy with what we achieved in this cycle with our small development team of Gyan and myself. Thank you for your hard work again, Gyan, in helping to realise my vision and interpreting my “specifications”.
As always, the demo server is always up-to-date with the latest code so you can go and try out what’s listed below.
Here we go…
Map photo clustering

Our map view is a feature that’s often commented on by users and really fits the spatial way I think about finding photos. As more and more geo-tagged photos get added to a library, we need to consider what exactly should be displayed on the map. Is it useful for a user to see thousands of individual pins on a map and will the user’s browser struggle to display them all?
We use a library called Leaflet for the main part of our mapping interface and found a library called Leaflet.markercluster which can handle clustering. If two pins are too close to each other, it will group them together and display a circle with a number instead. The number signifies how many markers it represents and clicking the circle zooms the map until individual pins are far enough apart to be visible.
My original plan was to calculate these clusters on the server-side and fetch more data as the user zoomed in. We may still need to do this if performance ever becomes a problem but I believe this implementation will serve users well for a while based on the examples. Some complexities would have been involved in doing things server-side — having to account for the user’s screen size and performing geo-spatial queries. All geo-tagged photo locations are fed into the map library and the clustering is done client-side. To ensure this is still efficient, we fetch the minimum data fields required using GraphQL. This is a separate API call now as we don’t want chunking/pagination and so that the server can filter to just the photos that have GPS coordinates.
Histograms
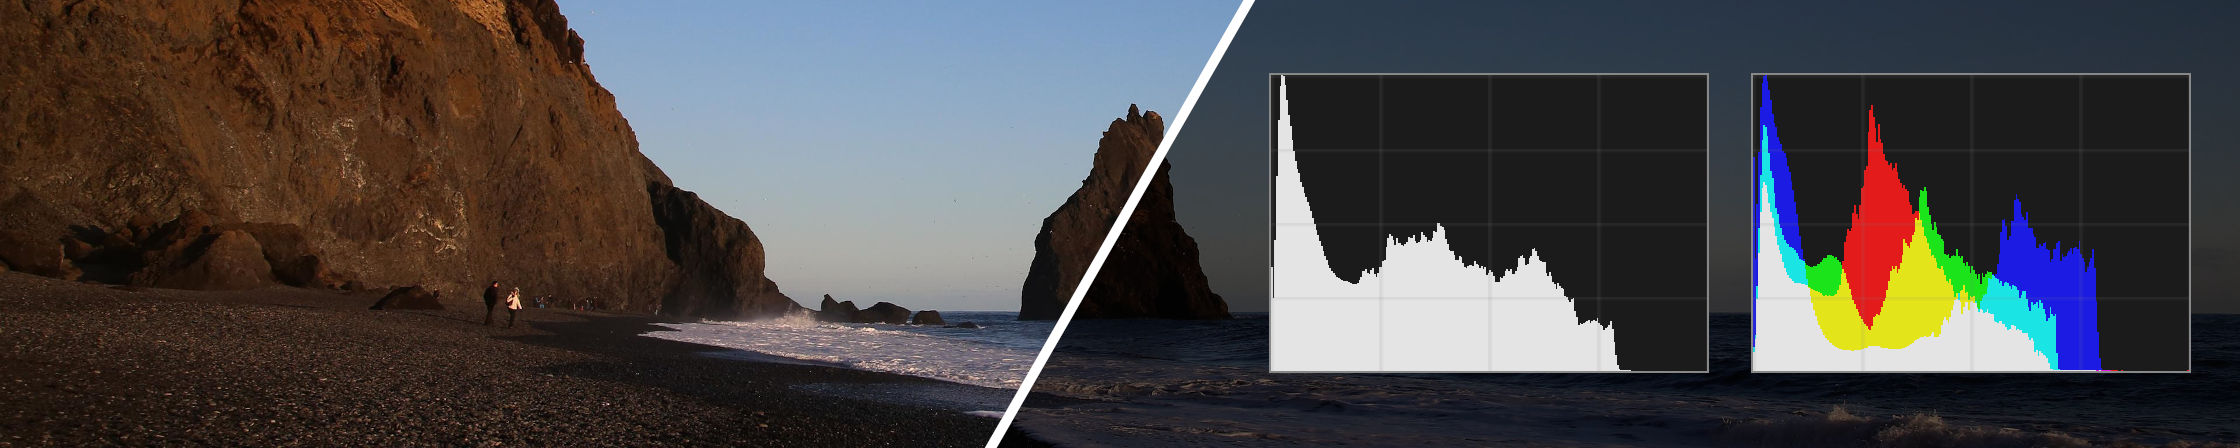
This is one feature I’m very excited about as I think it really shows that Photonix is heading in the direction of a professional, yet easy-to-use, tool. When I’m taking photos I’m always looking at my camera’s histogram to check the exposure. When reviewing and comparing photos I find it a useful tool to identify issues such as highlight clipping. Having quick access to this is great. It’s one of those features that I don’t imagine being included in mainstream tools like Google Photos any time soon.
If you are not familiar with histograms in photography then I’ll try and explain the basics, though Wikipedia will probably do a better job. Along the horizontal x-axis you have 256 levels of brightness from black on the left to white on the right. These 256 levels are buckets with a count value. We measure the brightness of each pixel in the image and increment the count for the bucket that matches it’s brightness. Once we have measured every pixel we can find the brightness bucket that has the largest count and use that to determine a scale for the vertical y-axis to make a bar graph that fits in the available display area.
Our histogram actually is a bit more complicated than this as it has two operating modes and you can click it to switch between them. One has separate buckets for RGB (Red, Green, Blue) channels which get overlaid in the graph and blended together. This is useful for identifying general colour casts and peaks in individual channels. In the other mode, RGB values are all added together to get an overall intensity (greyscale) graph.
To access the histogram for a photo, click it’s thumbnail and scroll down to the extra info. I am planning to change how image info is accessed as it’s not the most discoverable and interferes with another feature we’re working on — Gesture-based zooming and panning of images #153.
Multiple library switching
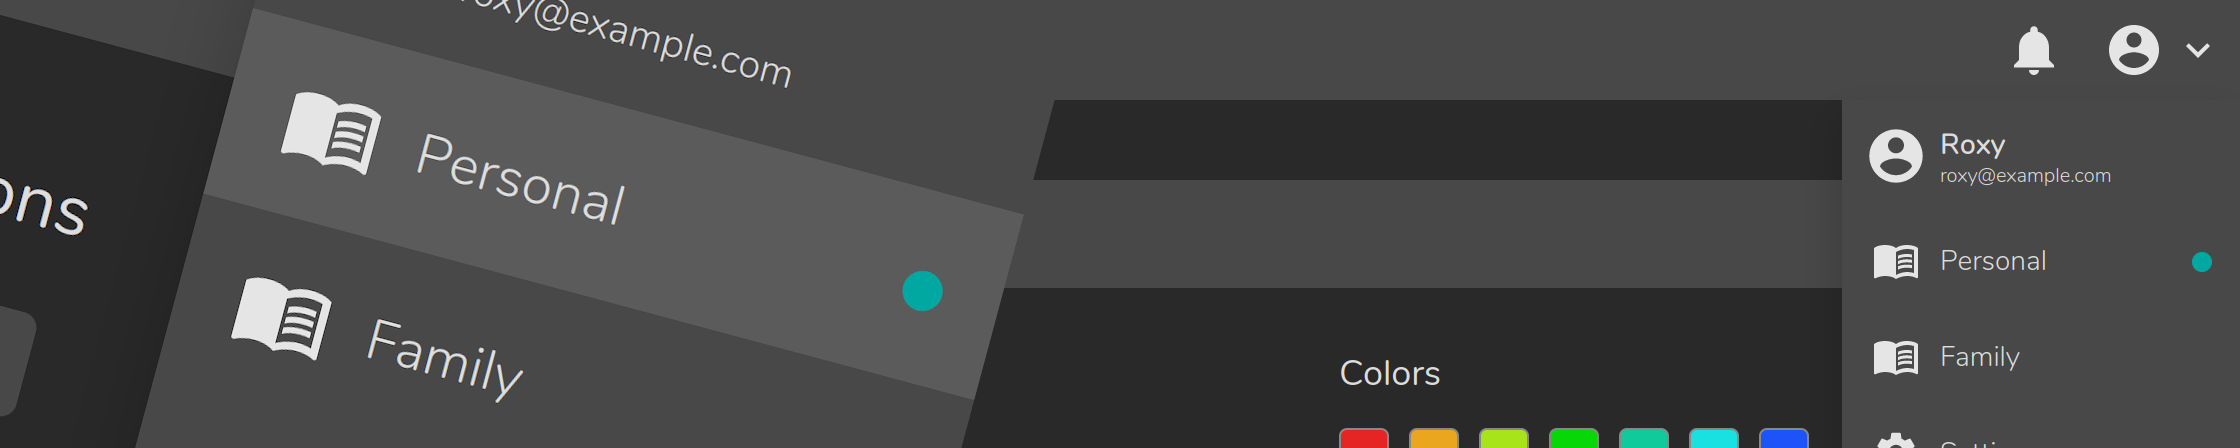
In co-ordination with our multi-user support, I see multiple library support as a structural part of the project. Users on a Photonix server should of course have their own photo collection but it’s also useful for users to collaborate. If you have a partner or family you may want be able to share and allow others to upload to a single place. Libraries can even live on separate types of storage medium or be made public in future. If you have a need for a separate library then I think you should be able to create one easily without having to sign in as a different user.
This month’s instalment lets you see and switch between libraries via the account menu in the top-right corner. Ability to easily create new libraries is a feature coming in the future so stay tuned.
Color detection model improvements
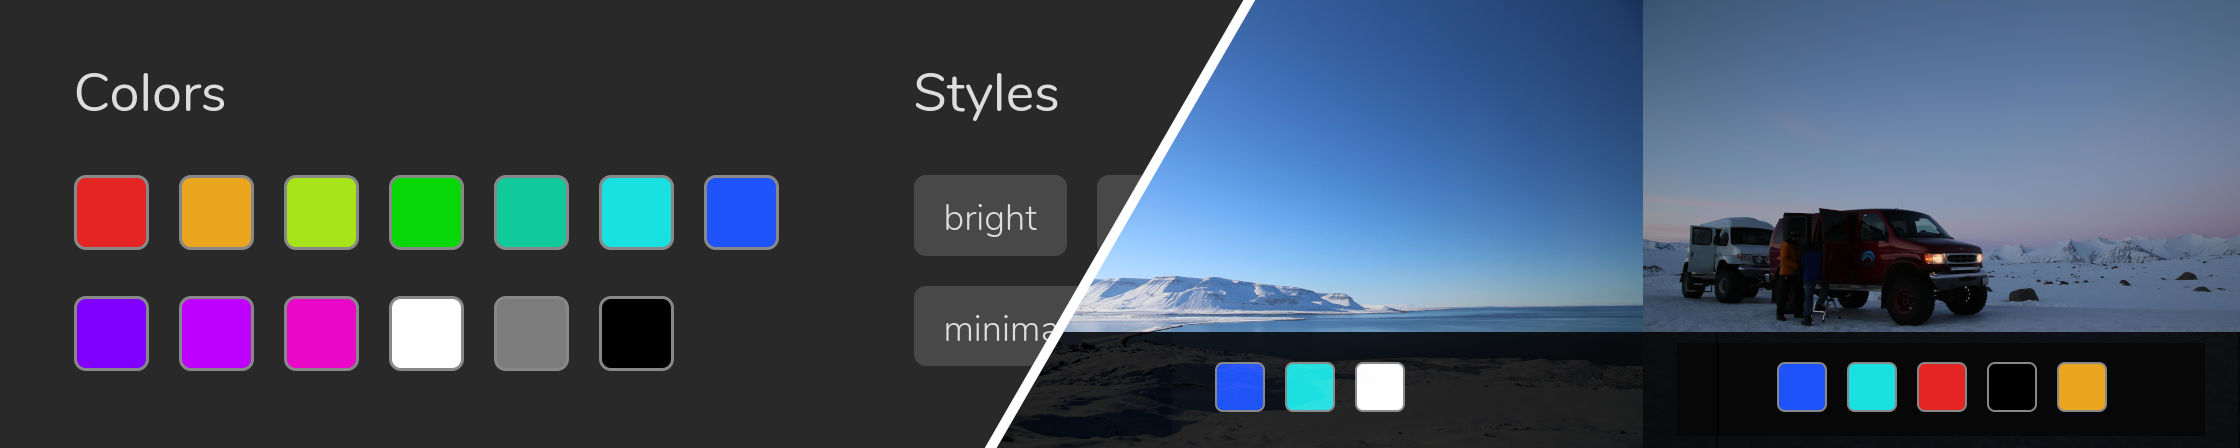
The color (or colour as we say in the UK) detection model has been around for a while. It served a purpose but there were always some known quirks (and probably still are). With an analyser like this, so much of it is qualitative and needs tweaking until it looks right across a sample of images.
To start with, the palette of detected colors was switched to one more similar to other color-filtering search engines online. This seems to cover more of the whole spectrum and is more visually appealing — which is always nice. Other tweaks were made to the resizing stages and minimum score threshold so there should be fewer random-looking colors showing up. Finally some of the colors were tweaked; for example I noticed photos of red things are never as saturated as true red.
Hopefully you find this simple analyser is now even more useful. If you want to take an even more in-depth look at how this and the other analysers work, you can read more on our updated Image Analysis documentation.
Show and hide object detection bounding boxes
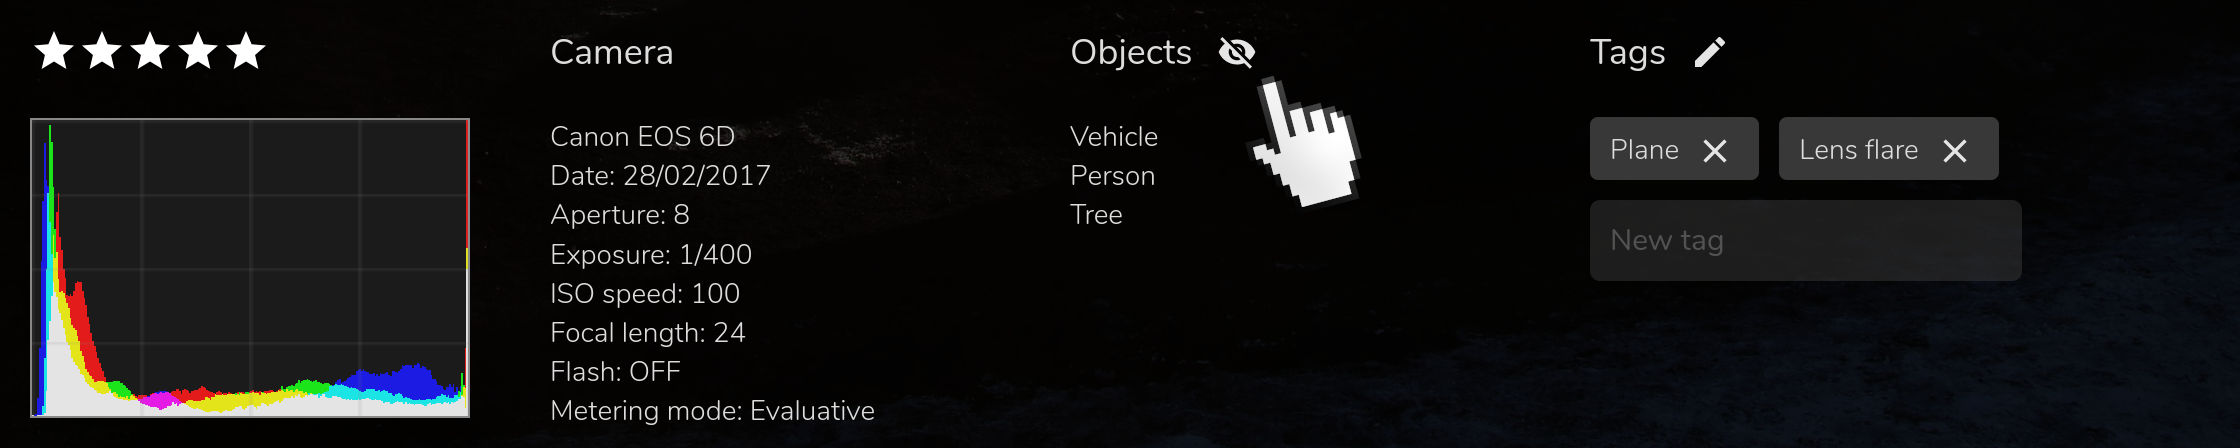
A simple but essential feature. When the object detection analysis was implemented I figured it was important (for debugging at least) to show the bounding boxes for the things that were detected in photos. Quite often (or maybe always) you’re more interested in looking at your photos without red boxes drawn all over them.
Clicking the eye icon shows and hides these boxes. The state of this option is stored in your browser’s localStorage so it will stay the way you like it when you return to the app.
Fixes for file change event watching
Introducing multiple libraries brought with it some issues. We have a background service based on inotify which imports files as soon as they are added to the library’s watch folder. Multiple libraries means we need to watch multiple watch folders at the same time and do something when an event happens. Because of the parallel event streams that need to be handled, this code was rewritten to use Python’s asyncio library along with async-compatible inotify library asyncinotify.
Other minor improvements
- Allow account menu to be accessed on mobile devices #177
- Performance improvements to initial page load
- Additions to Photonix Documentation
Nearly there
- ARM / Raspberry Pi build #67 — Good progress was made on this and the system mostly works. There’s one major outstanding issue that means the location analyser doesn’t work due to Matplotlib failing to be properly installed. If you think you could help, give this
docker-compose.ymlfile a go and see our documentation on Docker image cross-compiling. - Gesture-based zooming and panning of images #153
- Faceted search of remaining filters #6
Until next time…
Hope you enjoyed this instalment. Please leave any feedback via our social media channels and tell a friend about this project if you think it’s cool. I’ve just started a Photonix community on Reddit so it would be great if you could join there. If you’d like to be notified of our next update, add yourself to the newsletter using the form below.
Thanks for reading,
Damian
Header photo by Nasa